Canadian home comparisons
Freehold vs Condo Townhouse: Fees, Repairs and Control
Look beyond the listing label to compare maintenance, shared charges, insurance, documents and everyday control.
BestRealEstateAgency Editorial · Reviewed October 28, 2026
The short answer
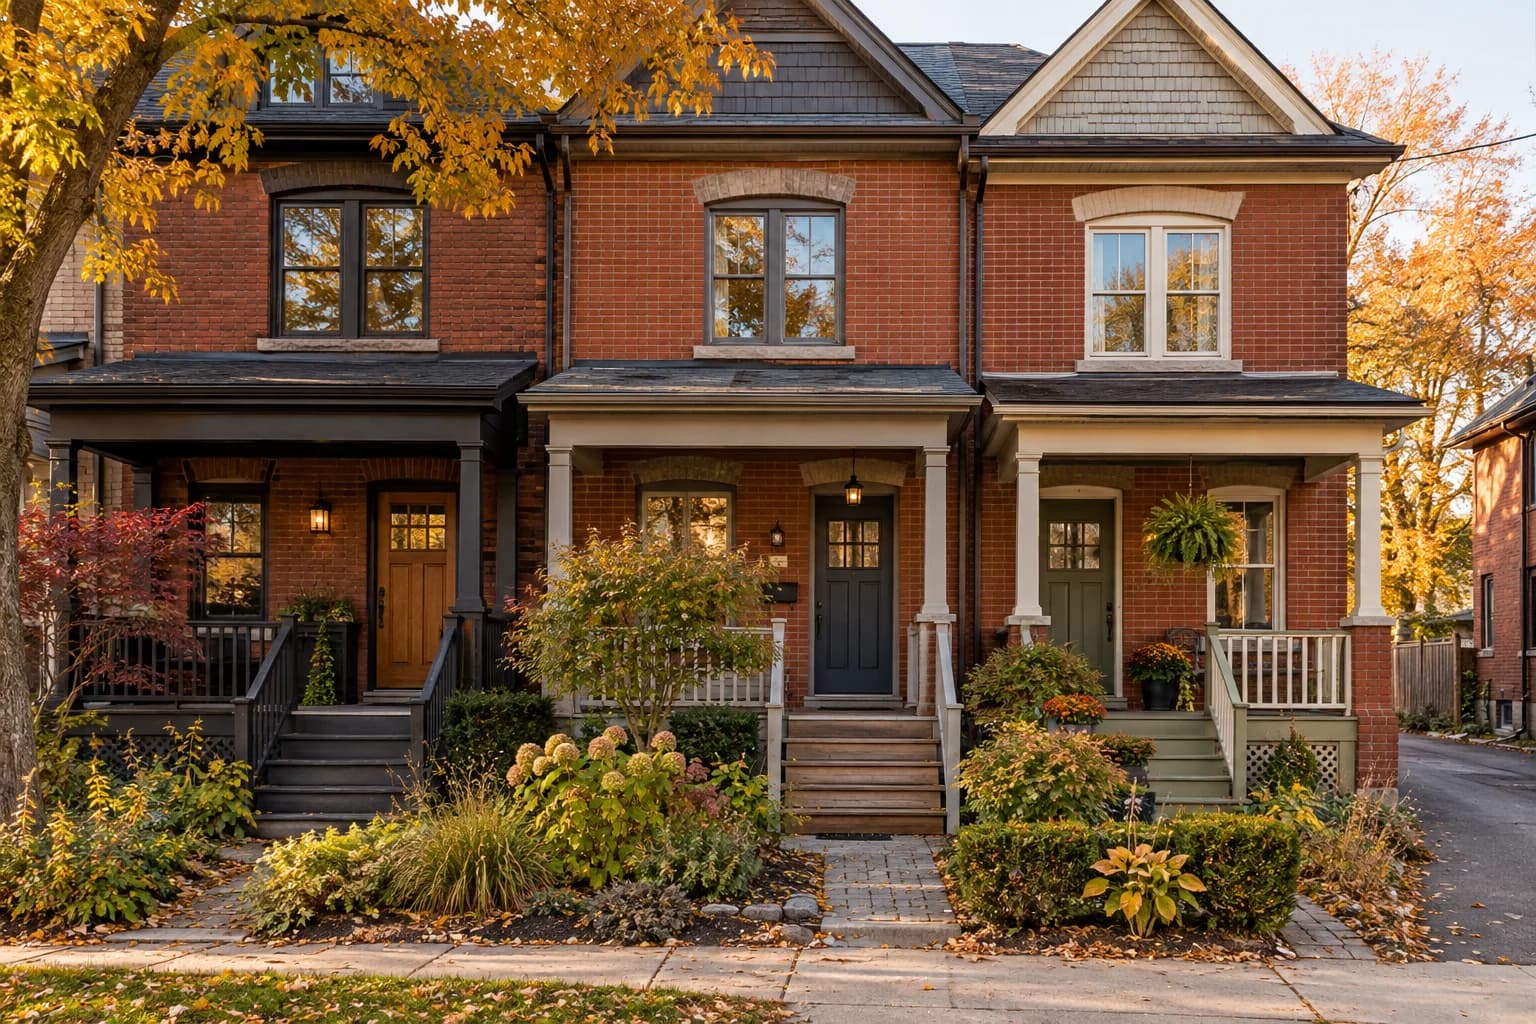
In everyday listings, a freehold townhouse usually means a non-condominium home and lot, while a condo townhouse belongs to a condominium or strata development. The practical difference is how costs, repairs and decisions are shared. Freehold does not guarantee zero shared fees; confirm the title and agreements.
| Question | Non-condominium freehold townhouse | Condo townhouse |
|---|---|---|
| What do you buy? | The home and lot, subject to registered interests | A defined unit and an interest in common property |
| Who plans major repairs? | Generally the owner; shared agreements may apply | Owner or corporation depending on the component |
| Are there fees? | Possibly shared-service or common-element charges | Regular common expenses, with possible additional assessments |
| Can you change the exterior? | Subject to permits, title restrictions and agreements | Approvals and governing documents may limit changes |
| What insurance is needed? | Coverage matched to the building and shared obligations | Unit coverage coordinated with corporation coverage |
Use this as a starting framework. Ownership, repair duties and permitted use depend on the property documents and the province; verify them for each shortlisted home.
Freehold vs condo townhouse lifestyle: same shape, different workload
Two townhouses can look almost identical while asking very different things of their owners. The everyday comparison is often less about bedrooms and more about who organizes snow clearing, gardening, roof work and shared-area problems. A buyer who likes arranging projects may value direct control; someone with unpredictable work hours may value coordinated services.
For a condo townhouse, check the services actually included before picturing a hands-off lifestyle. You may still shovel particular steps, care for a garden or arrange repairs inside the unit. For a non-condominium freehold townhouse, ask whether any private-road or shared-service agreement limits the freedom you expect.
Consider your tolerance for collective decisions. Coordinated exterior work can reduce the number of contractors you arrange, but the schedule, finish or cost may not be your first choice. More individual control can let you plan around your household, while leaving you to obtain quotes, arrange access and resolve shared-wall or drainage questions.
- A busy schedule: compare recurring chores and contractor coordination, not just fee amounts.
- A gardening or renovation hobby: confirm the changes you can make and the approvals they require.
- Frequent travel: arrange a property contact and check access, vacancy and insurance conditions for either structure.
- Neighbour relations: ask how parking, shared access, noise and maintenance disagreements are handled.
Aging in place, family routines and community
A condo townhouse does not automatically solve stairs or accessibility. Compare the entrance, bedroom and bathroom levels, laundry location and potential for later adaptations. A freehold townhouse with a suitable layout can be easier to live in than a poorly arranged condo townhouse, and the reverse is also true.
Shared courtyards and facilities can create opportunities to meet neighbours, but they also mean negotiating shared space. A more independent lot may give you a different relationship with the street and garden. During a viewing, check where children could play, how guests arrive and whether the household has enough quiet space.
- Ask who will do the work if your time, mobility or household size changes.
- Check storage for bikes, seasonal equipment, a stroller or mobility aids.
- If building layout is your main uncertainty, use the condo and townhouse floor-plan comparison before deciding between ownership structures.
What freehold means in a townhouse listing
Freehold and condominium are not perfect legal opposites. For example, CMHC’s condominium glossary also uses the term freehold condominium. This guide uses “non-condominium freehold” when describing a home outside that ownership structure.
Ask your lawyer or notary to explain the legal description, boundaries and registered obligations. Confirm that the ownership structure fits the day-to-day responsibilities you are willing to take on.
Can a freehold townhouse have maintenance fees?
Yes. Shared roads, private services or common facilities may create charges even when the home is marketed as freehold. Ontario’s Condominium Act provisions for common-elements condominiums describe common interests attached to parcels of land. A parcel of tied land, often called POTL in listings, needs a different review from a simple “no condo fee” assumption.
Ask what each payment covers, who sets it, how future increases are decided and whether additional contributions can be required. Compare the obligations attached to the specific lot; terminology and structures vary across provinces.
- Request agreements for roads, snow clearing, drainage and shared facilities.
- Check whether a payment is a condo expense, service charge or another obligation.
- Ask about planned projects and costs outside the regular payment.
Who repairs the roof, windows and driveway?
Do not assume the corporation fixes every exterior item. Have the declaration, plan, bylaws and relevant agreements checked for each component. A townhouse owner may be responsible for items that look shared, or need approval before replacing something they must pay for.
For a non-condominium home, build a repair plan from an inspection and quotes for larger work. Discuss party walls, access for contractors, drainage and any shared driveway. Decide whether you can manage the work as well as fund it.
British Columbia listings may describe a strata townhouse or bare land strata. Do not infer building insurance or repair coverage from the word strata alone: provincial guidance explains that bare land strata insurance can differ. Obtain the actual policy and documents. In Quebec, have your notary explain the co-ownership structure and the responsibilities attached to the unit.
Use a complete budget to compare the two
Write down financing, taxes, insurance, utilities, regular fees and a repair allowance for each property. For an illustrative comparison, a home with $450 in shared fees and $150 in other monthly repair savings has the same $600 allowance as one with no shared fees and $600 in repair savings. That arithmetic says nothing about the actual condition or adequate reserve amount; obtain property-specific estimates.
The condo fee calculator hub helps isolate shared expenses. Separately use the property tax calculator hub for the relevant jurisdiction, then check the property’s actual tax bill. Ask a lender how each home’s fees affect your financing assessment.
Insurance and approvals need their own review
Ask an insurer to quote the actual home and explain what falls between your policy and any corporation policy. For condo ownership, ask about improvements, deductibles and assessment-related coverage. For non-condominium ownership, explain shared walls, common services and any agreements to the insurer.
Compare the changes you expect to make: windows, a deck, fencing, an EV charger or a finished basement. Check both municipal requirements and private restrictions. More direct ownership does not remove permits or registered obligations.
Which ownership structure suits you?
Choose based on the duties you want to control and the risks you can fund. A condo townhouse may suit a buyer who values coordinated maintenance and accepts collective decisions. A non-condominium townhouse may suit someone who wants to arrange work directly and can handle irregular bills.
For resale, ask for comparisons within the same ownership structure before comparing broader townhouse averages. If the plan is to rent it out, stress-test the rental cash flow and confirm the permitted use. The Buyer Hub connects the next steps on financing, closing and selecting an agent.
Who owns these homes in Canada? Age and income context
In the 2021 Census, 66.5% of Canadian private households owned their home, including condominium owners. 9.4% of all private households owned and occupied a condominium of any building type. Those condo households are a subset of homeowners, not an additional group to add to the homeownership rate.
Age below refers to the primary household maintainer, the first listed contributor to housing expenses, not necessarily the largest payer or legal owner. It is not the age of every owner or resident. These national 2021 household patterns describe who lived where; they do not tell you which home is appropriate for your age or what you can afford today.
Within each age group, who owns or rents what?
| Maintainer age | Own any home | Own a condo row house | Own a non-condo row house |
|---|---|---|---|
| 15–24 | 18.6% | 0.6% | 0.5% |
| 25–34 | 45.5% | 1.6% | 2.1% |
| 35–44 | 64.1% | 2.0% | 2.9% |
| 45–54 | 71.7% | 2.0% | 2.7% |
| 55–64 | 75.0% | 2.0% | 2.1% |
| 65–74 | 75.2% | 2.3% | 1.7% |
| 75–84 | 72.5% | 2.5% | 1.4% |
| 85+ | 68.4% | 2.3% | 1.1% |
| All ages | 66.5% | 2.0% | 2.2% |
Non-condominium status is a census category, not proof of freehold legal title. These are the closest published categories for this comparison; the data cannot determine a particular property's title, shared-service obligations or marketing label.
See the age profile within each housing group
| Maintainer age | Own a condo row house | Own a non-condo row house |
|---|---|---|
| 15–24 | 0.9% | 0.7% |
| 25–34 | 11.2% | 13.4% |
| 35–44 | 17.1% | 23.5% |
| 45–54 | 17.6% | 22.3% |
| 55–64 | 20.4% | 19.8% |
| 65–74 | 18.6% | 12.9% |
| 75–84 | 10.7% | 5.8% |
| 85+ | 3.5% | 1.6% |
Income context: household income, not a salary requirement
The 2021 Census housing release reported median total household income in 2020 of $102,000 for owner households and $54,800 for renter households. These are before-tax household incomes across all home types, not individual salaries or condo/townhouse income estimates.
The age-and-property table above does not provide a matching salary breakdown. We have not assigned a salary to an age group or property type. Household income may include several earners and sources other than employment, and 2020 incomes were affected by pandemic supports. These historical medians are not a current mortgage-qualification threshold.
Adapted from Statistics Canada, 2021 Census, Table 98-10-0231-01: Age of primary household maintainer by tenure, Canada, all household types, household-count statistic, 25% sample data; and the September 21, 2022 housing release for 2020 income context. This does not constitute an endorsement by Statistics Canada of this product. Source household counts are rounded, so derived percentages and age totals may not add exactly. Retrieved October 28, 2026.
New-build price history by city
These public indices track changes in builders’ and developers’ new-home selling prices. They do not measure resale appreciation, average sale prices or an individual owner’s investment return.
Market context only: the new-house index groups single, semi-detached and row homes together. It does not separate freehold from condominium townhouses or establish which ownership structure appreciated more.
Calgary: Sep 1996–Sep 2026
- New houses (single / semi / row)
| Series | Total change | Annualized growth (CAGR) |
|---|---|---|
| New houses (single / semi / row) | +271.6% | +4.5% |
View chart data
| Period | New houses (single / semi / row) change |
|---|---|
| Sep 1996 | +0.0% |
| Oct 1996 | +0.3% |
| Nov 1996 | +1.4% |
| Dec 1996 | +3.2% |
| Jan 1997 | +3.4% |
| Feb 1997 | +3.7% |
| Mar 1997 | +4.3% |
| Apr 1997 | +4.6% |
| May 1997 | +5.2% |
| Jun 1997 | +5.7% |
| Jul 1997 | +6.0% |
| Aug 1997 | +6.3% |
| Sep 1997 | +6.9% |
| Oct 1997 | +8.0% |
| Nov 1997 | +8.6% |
| Dec 1997 | +9.7% |
| Jan 1998 | +11.2% |
| Feb 1998 | +11.5% |
| Mar 1998 | +12.0% |
| Apr 1998 | +12.6% |
| May 1998 | +13.2% |
| Jun 1998 | +14.3% |
| Jul 1998 | +14.9% |
| Aug 1998 | +15.5% |
| Sep 1998 | +15.8% |
| Oct 1998 | +15.8% |
| Nov 1998 | +15.8% |
| Dec 1998 | +16.9% |
| Jan 1999 | +17.5% |
| Feb 1999 | +17.8% |
| Mar 1999 | +18.6% |
| Apr 1999 | +18.9% |
| May 1999 | +18.9% |
| Jun 1999 | +19.2% |
| Jul 1999 | +19.5% |
| Aug 1999 | +19.8% |
| Sep 1999 | +20.6% |
| Oct 1999 | +20.9% |
| Nov 1999 | +20.9% |
| Dec 1999 | +21.5% |
| Jan 2000 | +21.5% |
| Feb 2000 | +21.5% |
| Mar 2000 | +21.8% |
| Apr 2000 | +21.8% |
| May 2000 | +22.3% |
| Jun 2000 | +22.1% |
| Jul 2000 | +22.3% |
| Aug 2000 | +22.6% |
| Sep 2000 | +22.6% |
| Oct 2000 | +23.2% |
| Nov 2000 | +23.2% |
| Dec 2000 | +23.2% |
| Jan 2001 | +23.5% |
| Feb 2001 | +23.8% |
| Mar 2001 | +24.1% |
| Apr 2001 | +24.1% |
| May 2001 | +24.1% |
| Jun 2001 | +25.2% |
| Jul 2001 | +25.8% |
| Aug 2001 | +25.8% |
| Sep 2001 | +26.4% |
| Oct 2001 | +26.6% |
| Nov 2001 | +27.2% |
| Dec 2001 | +27.5% |
| Jan 2002 | +28.1% |
| Feb 2002 | +28.7% |
| Mar 2002 | +30.1% |
| Apr 2002 | +30.7% |
| May 2002 | +31.5% |
| Jun 2002 | +32.1% |
| Jul 2002 | +32.4% |
| Aug 2002 | +33.0% |
| Sep 2002 | +33.2% |
| Oct 2002 | +33.8% |
| Nov 2002 | +34.4% |
| Dec 2002 | +35.2% |
| Jan 2003 | +35.5% |
| Feb 2003 | +36.1% |
| Mar 2003 | +37.0% |
| Apr 2003 | +37.2% |
| May 2003 | +37.8% |
| Jun 2003 | +38.7% |
| Jul 2003 | +38.7% |
| Aug 2003 | +39.0% |
| Sep 2003 | +39.8% |
| Oct 2003 | +41.0% |
| Nov 2003 | +41.8% |
| Dec 2003 | +43.3% |
| Jan 2004 | +43.6% |
| Feb 2004 | +43.8% |
| Mar 2004 | +44.7% |
| Apr 2004 | +45.3% |
| May 2004 | +45.8% |
| Jun 2004 | +46.7% |
| Jul 2004 | +47.0% |
| Aug 2004 | +47.6% |
| Sep 2004 | +48.1% |
| Oct 2004 | +48.4% |
| Nov 2004 | +48.4% |
| Dec 2004 | +48.7% |
| Jan 2005 | +49.0% |
| Feb 2005 | +49.9% |
| Mar 2005 | +50.1% |
| Apr 2005 | +51.3% |
| May 2005 | +52.1% |
| Jun 2005 | +53.9% |
| Jul 2005 | +53.9% |
| Aug 2005 | +54.7% |
| Sep 2005 | +57.6% |
| Oct 2005 | +62.8% |
| Nov 2005 | +68.5% |
| Dec 2005 | +76.5% |
| Jan 2006 | +79.9% |
| Feb 2006 | +84.0% |
| Mar 2006 | +94.8% |
| Apr 2006 | +104.0% |
| May 2006 | +114.9% |
| Jun 2006 | +129.8% |
| Jul 2006 | +140.1% |
| Aug 2006 | +148.7% |
| Sep 2006 | +151.0% |
| Oct 2006 | +149.9% |
| Nov 2006 | +152.7% |
| Dec 2006 | +151.3% |
| Jan 2007 | +153.3% |
| Feb 2007 | +153.3% |
| Mar 2007 | +154.7% |
| Apr 2007 | +159.6% |
| May 2007 | +162.2% |
| Jun 2007 | +163.6% |
| Jul 2007 | +163.9% |
| Aug 2007 | +163.9% |
| Sep 2007 | +165.9% |
| Oct 2007 | +165.3% |
| Nov 2007 | +165.0% |
| Dec 2007 | +166.5% |
| Jan 2008 | +167.3% |
| Feb 2008 | +166.5% |
| Mar 2008 | +168.2% |
| Apr 2008 | +166.2% |
| May 2008 | +163.9% |
| Jun 2008 | +163.6% |
| Jul 2008 | +163.0% |
| Aug 2008 | +161.0% |
| Sep 2008 | +162.8% |
| Oct 2008 | +161.3% |
| Nov 2008 | +158.5% |
| Dec 2008 | +155.3% |
| Jan 2009 | +149.9% |
| Feb 2009 | +147.9% |
| Mar 2009 | +145.0% |
| Apr 2009 | +143.0% |
| May 2009 | +143.0% |
| Jun 2009 | +142.7% |
| Jul 2009 | +143.8% |
| Aug 2009 | +144.4% |
| Sep 2009 | +145.8% |
| Oct 2009 | +146.7% |
| Nov 2009 | +147.6% |
| Dec 2009 | +147.3% |
| Jan 2010 | +148.4% |
| Feb 2010 | +148.7% |
| Mar 2010 | +149.9% |
| Apr 2010 | +149.9% |
| May 2010 | +150.7% |
| Jun 2010 | +150.7% |
| Jul 2010 | +150.4% |
| Aug 2010 | +150.4% |
| Sep 2010 | +151.0% |
| Oct 2010 | +149.6% |
| Nov 2010 | +149.6% |
| Dec 2010 | +150.1% |
| Jan 2011 | +150.7% |
| Feb 2011 | +149.6% |
| Mar 2011 | +149.3% |
| Apr 2011 | +149.3% |
| May 2011 | +150.4% |
| Jun 2011 | +149.6% |
| Jul 2011 | +148.4% |
| Aug 2011 | +148.7% |
| Sep 2011 | +149.9% |
| Oct 2011 | +150.1% |
| Nov 2011 | +149.3% |
| Dec 2011 | +149.6% |
| Jan 2012 | +150.4% |
| Feb 2012 | +150.7% |
| Mar 2012 | +151.6% |
| Apr 2012 | +151.9% |
| May 2012 | +152.4% |
| Jun 2012 | +153.9% |
| Jul 2012 | +154.2% |
| Aug 2012 | +155.0% |
| Sep 2012 | +155.3% |
| Oct 2012 | +156.2% |
| Nov 2012 | +156.2% |
| Dec 2012 | +157.3% |
| Jan 2013 | +158.7% |
| Feb 2013 | +161.3% |
| Mar 2013 | +162.5% |
| Apr 2013 | +163.6% |
| May 2013 | +165.9% |
| Jun 2013 | +167.3% |
| Jul 2013 | +168.8% |
| Aug 2013 | +170.5% |
| Sep 2013 | +171.6% |
| Oct 2013 | +171.9% |
| Nov 2013 | +172.8% |
| Dec 2013 | +173.4% |
| Jan 2014 | +176.8% |
| Feb 2014 | +179.4% |
| Mar 2014 | +181.9% |
| Apr 2014 | +183.7% |
| May 2014 | +186.0% |
| Jun 2014 | +186.8% |
| Jul 2014 | +187.4% |
| Aug 2014 | +188.8% |
| Sep 2014 | +189.4% |
| Oct 2014 | +190.0% |
| Nov 2014 | +190.8% |
| Dec 2014 | +191.1% |
| Jan 2015 | +191.1% |
| Feb 2015 | +191.1% |
| Mar 2015 | +189.7% |
| Apr 2015 | +188.8% |
| May 2015 | +188.8% |
| Jun 2015 | +188.8% |
| Jul 2015 | +188.3% |
| Aug 2015 | +188.3% |
| Sep 2015 | +188.3% |
| Oct 2015 | +188.3% |
| Nov 2015 | +188.5% |
| Dec 2015 | +188.5% |
| Jan 2016 | +188.5% |
| Feb 2016 | +187.1% |
| Mar 2016 | +187.1% |
| Apr 2016 | +187.1% |
| May 2016 | +187.7% |
| Jun 2016 | +186.0% |
| Jul 2016 | +186.2% |
| Aug 2016 | +186.2% |
| Sep 2016 | +185.4% |
| Oct 2016 | +185.1% |
| Nov 2016 | +186.0% |
| Dec 2016 | +186.5% |
| Jan 2017 | +186.2% |
| Feb 2017 | +185.7% |
| Mar 2017 | +185.7% |
| Apr 2017 | +186.2% |
| May 2017 | +185.1% |
| Jun 2017 | +185.1% |
| Jul 2017 | +187.4% |
| Aug 2017 | +187.7% |
| Sep 2017 | +187.4% |
| Oct 2017 | +187.7% |
| Nov 2017 | +188.0% |
| Dec 2017 | +187.4% |
| Jan 2018 | +187.4% |
| Feb 2018 | +186.5% |
| Mar 2018 | +185.4% |
| Apr 2018 | +185.4% |
| May 2018 | +185.1% |
| Jun 2018 | +186.0% |
| Jul 2018 | +186.5% |
| Aug 2018 | +185.4% |
| Sep 2018 | +184.8% |
| Oct 2018 | +184.0% |
| Nov 2018 | +184.5% |
| Dec 2018 | +184.8% |
| Jan 2019 | +184.2% |
| Feb 2019 | +184.2% |
| Mar 2019 | +184.0% |
| Apr 2019 | +182.2% |
| May 2019 | +181.9% |
| Jun 2019 | +179.1% |
| Jul 2019 | +179.1% |
| Aug 2019 | +179.1% |
| Sep 2019 | +178.5% |
| Oct 2019 | +177.9% |
| Nov 2019 | +178.5% |
| Dec 2019 | +178.5% |
| Jan 2020 | +177.7% |
| Feb 2020 | +178.8% |
| Mar 2020 | +178.2% |
| Apr 2020 | +177.7% |
| May 2020 | +177.7% |
| Jun 2020 | +177.4% |
| Jul 2020 | +175.9% |
| Aug 2020 | +175.6% |
| Sep 2020 | +176.8% |
| Oct 2020 | +177.9% |
| Nov 2020 | +178.8% |
| Dec 2020 | +178.8% |
| Jan 2021 | +179.7% |
| Feb 2021 | +181.9% |
| Mar 2021 | +183.4% |
| Apr 2021 | +190.8% |
| May 2021 | +201.7% |
| Jun 2021 | +212.3% |
| Jul 2021 | +211.7% |
| Aug 2021 | +212.3% |
| Sep 2021 | +212.6% |
| Oct 2021 | +212.9% |
| Nov 2021 | +214.3% |
| Dec 2021 | +215.8% |
| Jan 2022 | +222.3% |
| Feb 2022 | +234.7% |
| Mar 2022 | +248.4% |
| Apr 2022 | +253.9% |
| May 2022 | +258.7% |
| Jun 2022 | +259.0% |
| Jul 2022 | +257.9% |
| Aug 2022 | +258.7% |
| Sep 2022 | +257.0% |
| Oct 2022 | +257.0% |
| Nov 2022 | +257.0% |
| Dec 2022 | +257.3% |
| Jan 2023 | +257.6% |
| Feb 2023 | +257.6% |
| Mar 2023 | +257.9% |
| Apr 2023 | +257.6% |
| May 2023 | +260.5% |
| Jun 2023 | +262.8% |
| Jul 2023 | +263.6% |
| Aug 2023 | +265.9% |
| Sep 2023 | +266.2% |
| Oct 2023 | +266.2% |
| Nov 2023 | +265.6% |
| Dec 2023 | +267.0% |
| Jan 2024 | +266.5% |
| Feb 2024 | +266.8% |
| Mar 2024 | +268.5% |
| Apr 2024 | +271.6% |
| May 2024 | +276.5% |
| Jun 2024 | +279.4% |
| Jul 2024 | +282.5% |
| Aug 2024 | +280.8% |
| Sep 2024 | +281.9% |
| Oct 2024 | +282.5% |
| Nov 2024 | +283.1% |
| Dec 2024 | +281.4% |
| Jan 2025 | +282.2% |
| Feb 2025 | +283.4% |
| Mar 2025 | +282.2% |
| Apr 2025 | +277.9% |
| May 2025 | +278.5% |
| Jun 2025 | +275.6% |
| Jul 2025 | +276.2% |
| Aug 2025 | +272.2% |
| Sep 2025 | +271.6% |
| Oct 2025 | +271.1% |
| Nov 2025 | +273.1% |
| Dec 2025 | +273.4% |
| Jan 2026 | +271.6% |
| Feb 2026 | +276.5% |
| Mar 2026 | +279.1% |
| Apr 2026 | +273.6% |
| May 2026 | +270.8% |
| Jun 2026 | +272.2% |
| Jul 2026 | +271.9% |
| Aug 2026 | +272.5% |
| Sep 2026 | +271.6% |
Adapted from Statistics Canada, New condominium apartment price indexes, Table 18-10-0273-01 (Q1 2017–Q2 2026), and New housing price index, Table 18-10-0205-01 (displayed monthly history September 1996–September 2026). This does not constitute an endorsement by Statistics Canada of this product. Data retrieved October 28, 2026, under the Statistics Canada Open Licence. Census metropolitan areas are broader than city limits. Growth is nominal and excludes inflation, ownership costs and rental income. CAGR compounds the endpoint indices over elapsed months; it is not the arithmetic average of annual changes.
Common questions
Is freehold always better than a condo townhouse?
No. Compare price, maintenance responsibility, shared obligations, condition and your willingness to manage repairs.
Does a freehold townhouse have no restrictions?
No. Permits, easements, covenants and shared-service agreements may affect what you can do. Review the title and proposed work.
Are condo townhouse fees always lower than apartment condo fees?
No. Compare services, the size and condition of the development, insurance and future maintenance plans rather than the building label.
What does POTL mean?
It means parcel of tied land. In an Ontario common-elements condominium, an interest in common elements is attached to a parcel. Have the title and cost obligations explained before buying.