
Island living
Victoria Housing Market Report
This Victoria housing market report tracks benchmark prices, rents, vacancy and property tax across Greater Victoria, using VREB, September 2026 Core HPI / July Greater Victoria SF and CMHC rental data.
MLS benchmark · VREB, September 2026 Core HPI / July Greater Victoria SF · Greater Victoria · Updated through September 2026
Victoria average price by property type
What each kind of home costs in Greater Victoria, and how far apart a house and an apartment have moved.
Detached
$1,280,100
House, not attached to a neighbour
All property types
$1,170,200
MLS benchmark
Condo
$547,800
The usual entry point
VREB, September 2026 Core HPI / July Greater Victoria SF, for Greater Victoria. A detached home costs 2.3× what a condo does here. Detached, all types and condo are the same measure from the same release (mls benchmark), so they can be compared with each other, though not directly against another city’s differently-measured figure. Victoria’s board does not publish a townhouse figure we hold, so this report leaves that segment out rather than estimating it.
Average cost by property type in Victoria
What each kind of home costs, from the same release.
All three from VREB, September 2026 Core HPI / July Greater Victoria SF, on the same basis (mls benchmark), so they can be compared with each other. Victoria's board does not publish a townhouse or row-house figure we hold, so this report shows the three segments it does publish rather than estimating a fourth.
What it costs to buy
The benchmark, where it has moved in twelve months, and the land transfer cheque that clears on closing day.
MLS benchmark
$1,170,200
VREB, September 2026 Core HPI / July Greater Victoria SF
12 month change
−2.0%
Composite, same source
Land transfer on closing
$21,404
At the benchmark, 20% down, no rebate
Condo benchmark
$547,800
The usual entry point
Victoria is not a cheap alternative to Vancouver. The BC property transfer tax applies identically, the first-time exemption phases out between $835,000 and $860,000 (above the condo benchmark, below the single-family one), and Greater Victoria spans thirteen separate municipalities with their own rates and rules. Compare neighbourhoods in Victoria to narrow the citywide figures to areas that fit your search.
Price and twelve month change: VREB, September 2026 Core HPI / July Greater Victoria SF. The closing figure is BC property transfer tax, calculated on the MLS benchmark at 20% down with no first-time rebate applied. Run your own price through the land transfer tax calculator or the closing costs calculator.
Continue in the Buyer HubFirst-time buyer guides, neighbourhoods and closing calculatorsWhat the market pays a seller
Where the detached and condo segments have split, and what comes out of the sale price before you see it.
Detached
$1,280,100
VREB, September 2026 Core HPI / July Greater Victoria SF
Condo
$547,800
Same board, same month
Detached to condo
2.3×
How many condos to one house
12 month change
−2.0%
What your comparables are worth now
Thirteen municipalities means the 'Victoria' benchmark is a regional composite covering very different submarkets. Core single-family and West Shore condo move on different cycles, and the regional number describes neither precisely. Before setting an asking price, use our guide to interviewing a Victoria real estate agent to ask for comparable sales and a clear pricing plan.
Sales counts, days on market and months of inventory are not published for Victoria in a form we hold, so this report does not show them. VREB reports prices at the board level; only TRREB publishes community-level activity, which is why Toronto is the one report here that carries those figures. We would rather omit a number than estimate it.
Detached and condo figures are from the same release as the composite, so the spread between them is like-for-like. What comes out of the sale price is a provincial question. See the commission calculator and the sale proceeds calculator.
Continue in the Seller HubCommission by province and what you actually netWhat the rent covers
Sitting rents, CMHC vacancy, gross yield on the benchmark, and the property tax drag underneath it.
Rent, 2 bedroom
$2,120
Per month, asking
Vacancy
3.3%
0.3% for rental condos
Gross yield
2.2%
Annual rent over price, before costs
Property tax
$5,617
0.48% on the benchmark, per year
Purpose-built vacancy sits at 3.3% while the condo rental pool is at 0.3%, effectively zero. Those two figures describe opposite businesses, and the one that applies depends entirely on what you buy.
Vacancy describes Greater Victoria, purpose-built and comes from VREB / CMHC, 2025. That area is wider than Victoria itself, so treat it as the backdrop rather than the rate on one building. Gross yield is annual two-bedroom rent over the MLS benchmark, before vacancy, tax, insurance and maintenance. It is not a cap rate. Property tax is Victoria’s residential rate of 0.48% applied to that same price.
Continue in the Investor HubCap rate and cash flow calculators by cityHow Victoria compares
The same measures across all eight markets. Switch the measure to move the ranking.
Where Victoria ranks
Benchmark, median or average price. Victoria is 1st of the eight markets on this measure.
Each board's own headline price figure. Montreal is a median and Winnipeg an average, so those two answer a slightly different question than the six benchmarks.
| Market | Price | 12 mo | Detached | Condo | Rent, 2br | Vacancy |
|---|---|---|---|---|---|---|
| VictoriaGreater Victoria | $1,170,200MLS benchmark | −2.0% | $1,280,100 | $547,800 | $2,120 | 3.3% |
| VancouverMetro Vancouver | $1,075,900MLS benchmark | −5.5% | $1,799,400 | $686,200 | $3,150 | 3.7% |
| TorontoGreater Toronto Area | $917,600MLS benchmark | −4.7% | $1,360,000 | $631,000 | $2,700 | 3.0% |
| MontrealMontreal CMA | $635,000Median price | +0.5% | $635,000 | $430,000 | $2,050 | 2.9% |
| OttawaOttawa Census Division | $623,500MLS benchmark | −0.3% | $705,100 | $380,800 | $2,300 | 3.0% |
| CalgaryCity of Calgary | $566,700MLS benchmark | −0.8% | $739,400 | $291,400 | $1,900 | 5.0% |
| HalifaxHalifax–Dartmouth | $541,700MLS benchmark | −4.1% | $610,000 | $420,000 | $1,826 | 2.7% |
| WinnipegWinnipeg Census Metropolitan Area | $408,020Board average | +2.3% | $454,264 | $290,522 | $1,550 | 2.8% |
Price and twelve month change come from each city’s own board, on the month named in that city’s report. They are not all the same month, and Montreal and Winnipeg publish medians and averages rather than a benchmark. Rents are market asking rents; vacancy is CMHC purpose-built for the CMA named on each report page, which is wider than the city proper.
Victoria against another market
Pick a second market to put beside this one. Both charts below answer a different question about the same pair.
Both charts below move together when you change this.
Detached, composite and condo
What each segment costs in Victoria against Toronto.
- Victoria
- Toronto
Same board release in each city, so the segments are like-for-like within a market. Across markets the measurement differs: VREB, September 2026 Core HPI / July Greater Victoria SF against TRREB, September 2026.
Tax on closing, as the price climbs
Land transfer, property transfer, welcome or deed tax at 20% down, with no first-time rebate.
- Victoria
- Toronto
Calculated from each province’s published brackets, the same functions behind our calculators. Victoria: BC property transfer tax. Toronto: Ontario LTT + Toronto municipal LTT. Alberta charges no land transfer tax at all, so its line is registration fees only and stays near the axis.
Go deeper in this market
Neighbourhood prices, agent coverage, and the calculators preloaded with this city's figures.
This Victoria housing market report is updated when the boards publish, and each refresh is logged in the changelog. Figures carry the month they were released, not the day you read them.
Victoria housing market changelog
What changed on this report at its last refresh, and how Victoria moved month by month through 2026.
Last refreshed October 29, 2026 · data through September 2026
- Headline moved from August to September: the Core single-family benchmark is $1,280,100, down 2.0% (was $1,301,800, down 0.6%). The Core condo benchmark is $547,800.
- Rewrote the summary: single-family is 4.4% below its April peak.
- Corrected the first-time buyer note: the exemption phases out between $835,000 and $860,000, above the condo benchmark and below the single-family one.
- Added January to September history. The Greater Victoria single-family figure used for the headline is still July's; VREB did not publish it for September.
| Month | Core single-family benchmark | Core condo benchmark | VREB sales | Notes |
|---|---|---|---|---|
| September 2026 | $1,280,100−2.0% | $547,800+1.0% | 463−16.4% | Down 4.4% from the April peak. Active listings reached 3,811, up 3.2% on a year earlier. |
| August 2026 | $1,301,800−0.6% | $553,600+0.9% | 591+12.6% | — |
| July 2026 | $1,311,000−2.8% | $548,600−2.2% | 673−1.0% | — |
| June 2026 | $1,326,500−0.6% | $549,200−1.9% | 719−5.5% | — |
| May 2026 | $1,339,000+0.3% | $551,400−1.9% | 713−5.9% | — |
| April 2026 | $1,339,100−1.2% | $558,300−0.8% | 643+0.2% | The single-family benchmark peaked for the year. |
| March 2026 | $1,330,200−1.1% | $553,800−0.8% | 579−5.5% | — |
| February 2026 | $1,307,400−0.9% | $545,600−0.7% | 465−11.9% | — |
| January 2026 | $1,265,500−2.5% | $537,800−1.5% | 339−19.7% | — |
Each month links to its archived report. Percentages under each figure are the change from the same month a year earlier. A dash means the board did not state that figure in a form we could read, and we do not fill it in. Both prices are the Victoria Core benchmarks from VREB's monthly release. Sales are the whole VREB region, all property types. Source: Victoria Real Estate Board, monthly statistics.
Sources
Every figure on this page, and where it came from.
Prices come from Victoria's own board on the month named above. Vacancy is CMHC's, and the tax figures are calculated from the published rates and brackets rather than quoted from a listing. Where a board publishes its release on the open web but we do not hold the link, the release is cited by name.
- Prices and twelve month changeVREB, September 2026 Core HPI / July Greater Victoria SF
- VacancyVREB / CMHC, 2025
- RentsMarket asking rents, held in our city comparison dataset
- Property tax rateVictoria residential rate, held in our property tax dataset
- Tax on closingBritish Columbia land transfer tax
Other housing market reports
The rest of the markets we track, most expensive first.

Vancouver Market Report
Greater Vancouver Realtors, September 2026

Toronto Market Report
TRREB, September 2026

Montreal Market Report
APCIQ, September 2026
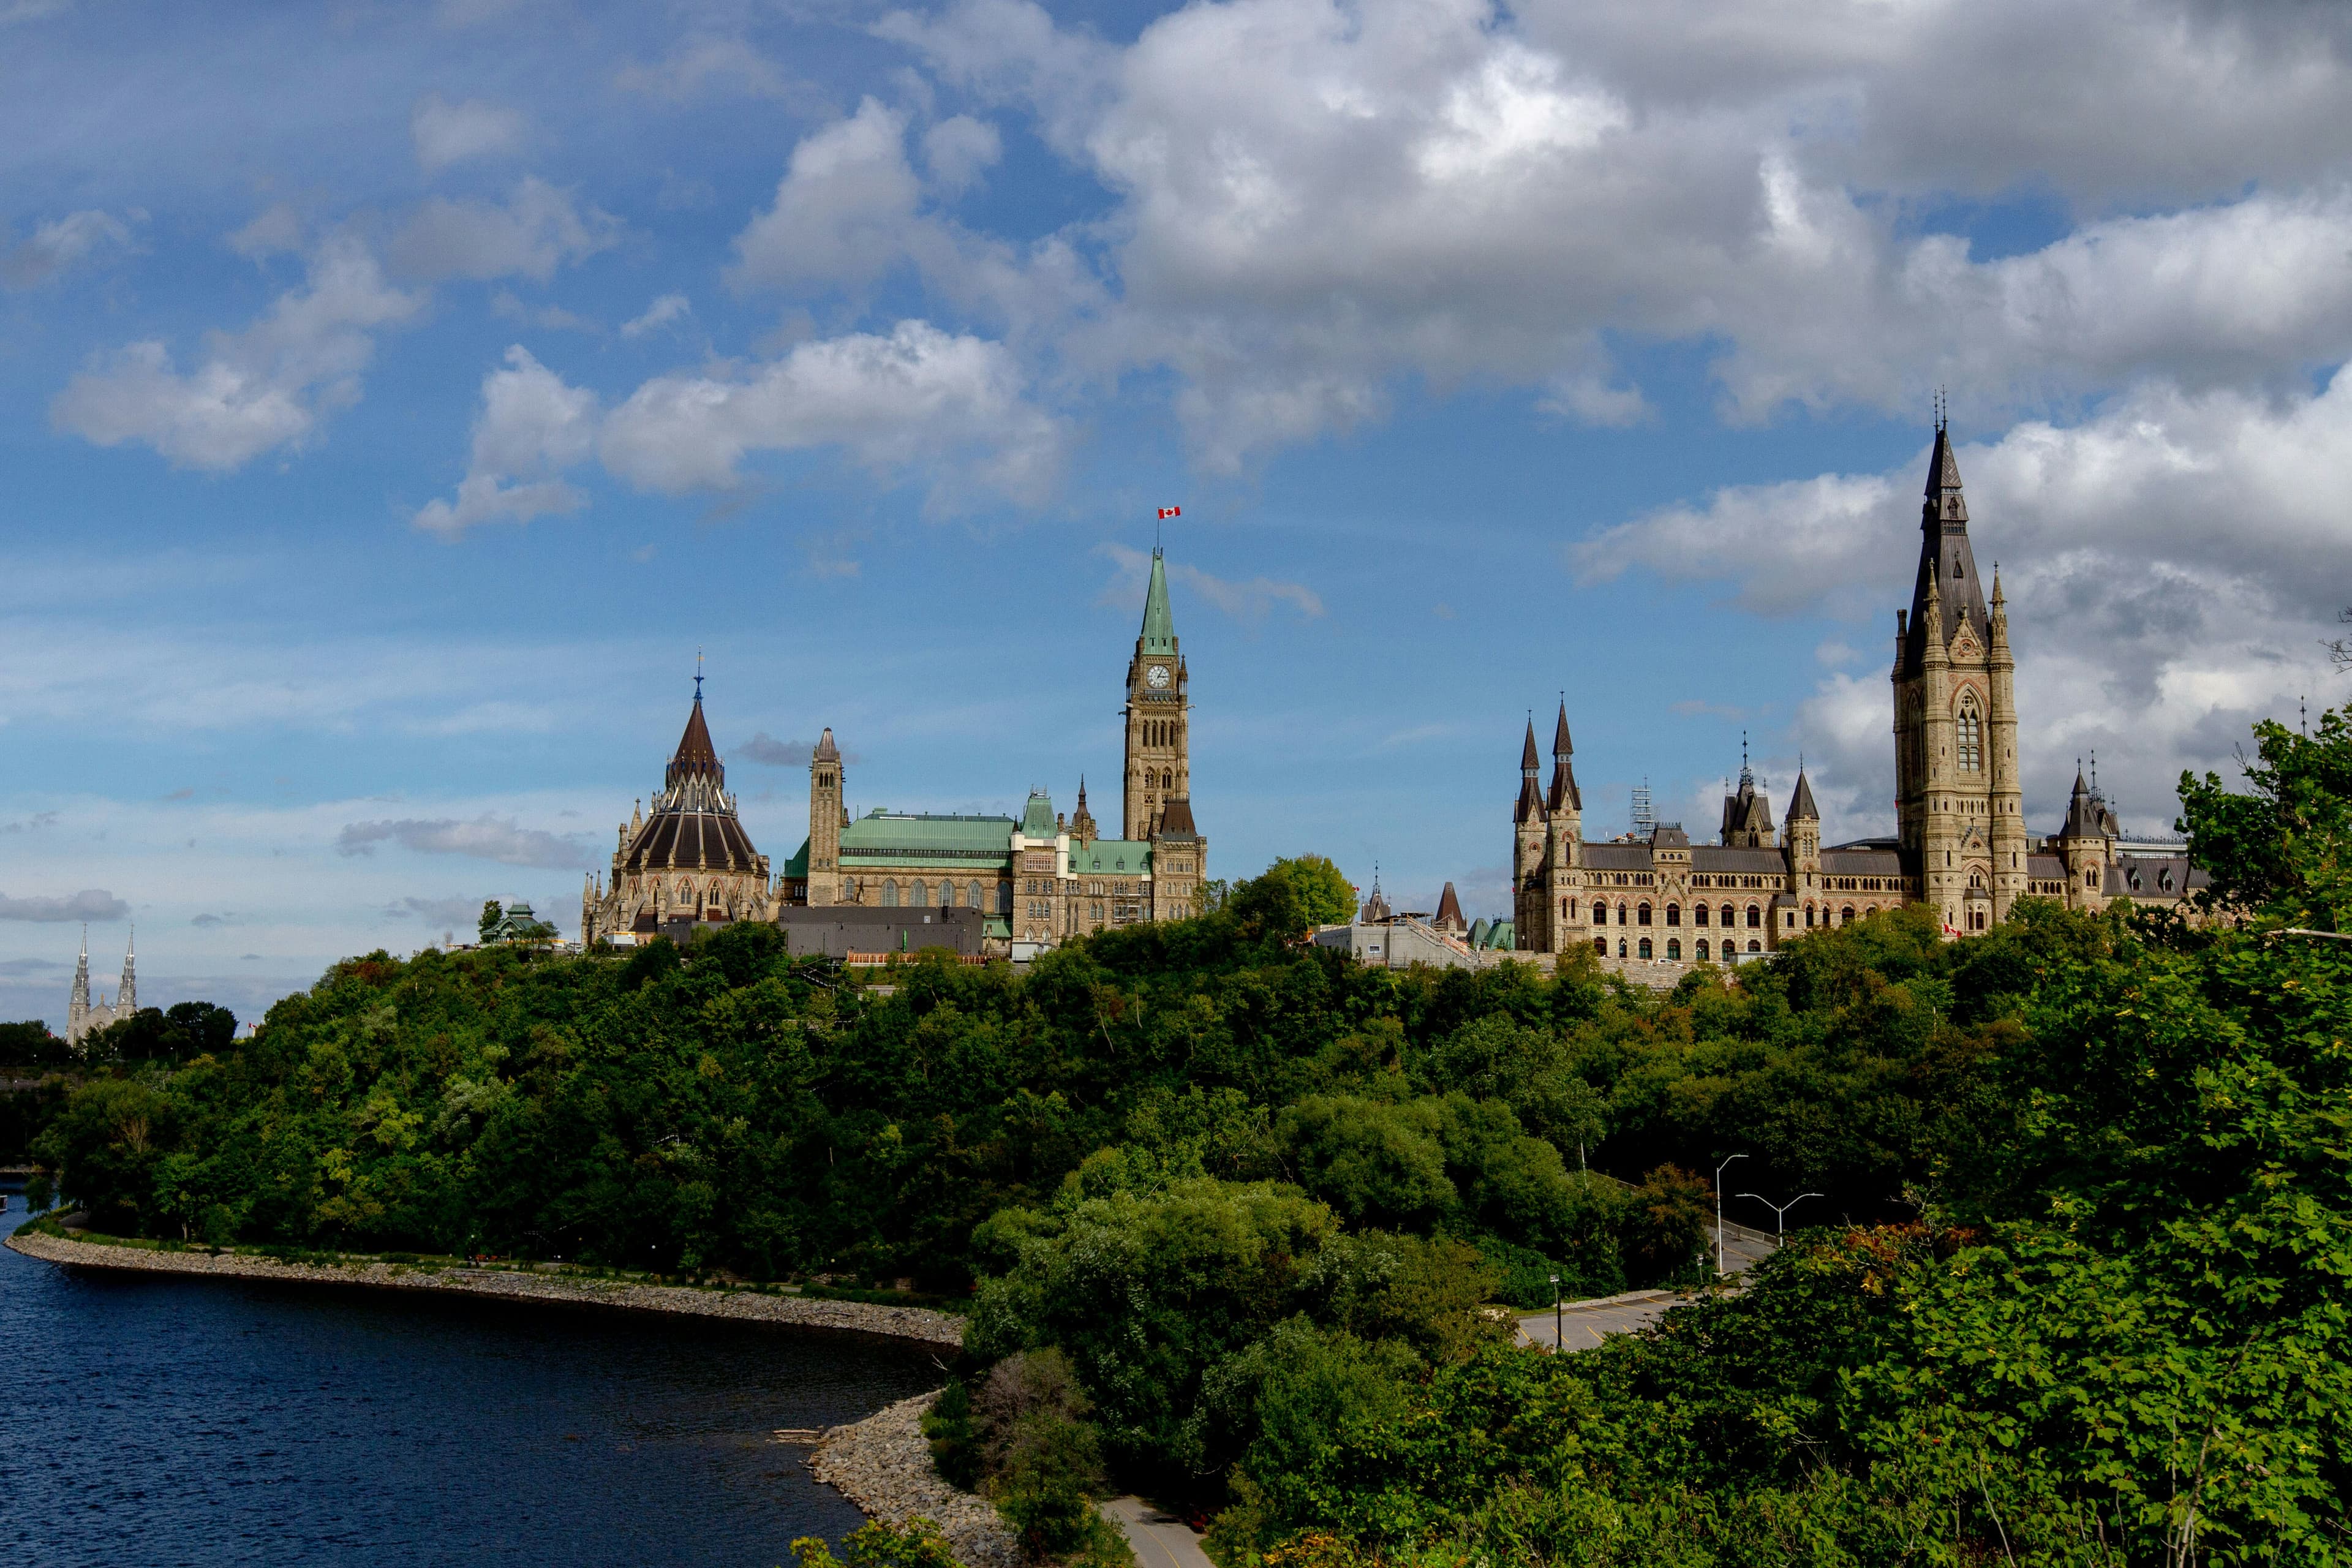
Ottawa Market Report
OREB, September 2026

Calgary Market Report
CREB, September 2026

Halifax Market Report
NSAR Halifax–Dartmouth MLS HPI, September 2026

Winnipeg Market Report
Winnipeg Regional Real Estate Board, July 2026
Get Victoria numbers from someone who works them daily
Board data tells you where Greater Victoria has been. An agent who closes here tells you what it means for your street, your building, and your timeline.
Free to use. No referral fees, and we never sell your details.